Developers and investors alike are most likely acutely aware of the population trends occurring in America. We have presented a summary of the most significant aging trends below. The demographic data supports McFarlin Group’s strategy of developing acute care assisted living and memory care (Alzheimer’s) communities.
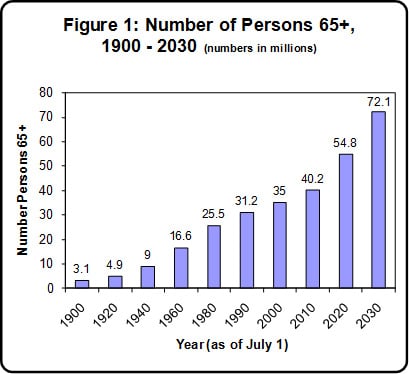
The demographics of the elderly population in the United States are quite familiar to most Americans, especially those in the senior services industry. America is aging, and as a result, the elderly account for a larger percentage of the population every year. Approximately 12.6 % of the current U.S. population is age 65 years and older. This figure is projected to increase to 16.3% by 2020 and to 19.7% by 2030. See the table below for senior population estimates.
|
Although the senior population age 65+ changes only +6.62% from 2010 to 2030, that represents an increase in the population ages 65+ of 78% from 40.2 million to 71.5 million seniors.
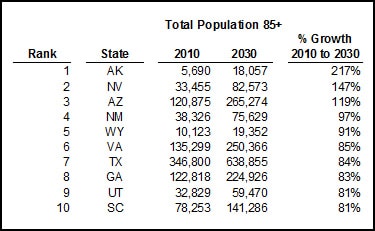
Texas is among the states with the greatest growth in the senior population from 2010 to 2030 with a total population age 65+ increase of just over 100% from 2.59 million seniors age 65+ to 5.19 million from 2010 to 2030. The growth within Texas is attributed to its relatively warm climate, no state income tax and significant military presence which attracts many Veterans. The Texas population age 85+ is projected to increase 84.2% over this same period. The states with the greatest percentage increase in senior population age 85+ (the age of the typical assisted living resident) from 2010 to 2030 is shown right.
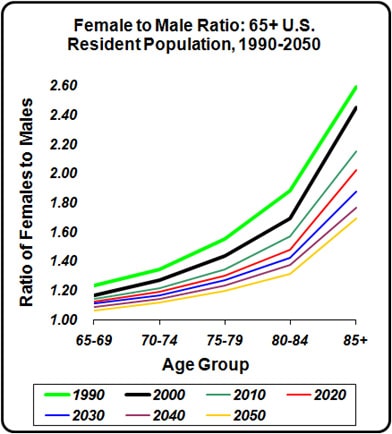
Among seniors age 65+ in 2010, women out-number men (23.2 million older women to 17 million older men). This results in a ratio of 1.37 women to men age 65+ in 2010. The trend occurring, as shown below, indicates that men will be living healthier, longer as the ratio of women to men decreases.